LEGION Simulator Components
Object Directory
Like LEGION Model Builder, LEGION Simulator has an Object Directory but it is simpler in that it only has two tabs: 'Objects' and 'Analysis'. The 'Objects' tab can only show or hide the objects in simulation, recording or playback (while you can see objects you cannot select, modify or delete them); the 'Analysis' tab enables you to view and edit Analyses, Colour Ranges, Graphs, Maps, Timeline Settings, Value Ranges and Desire Plots.
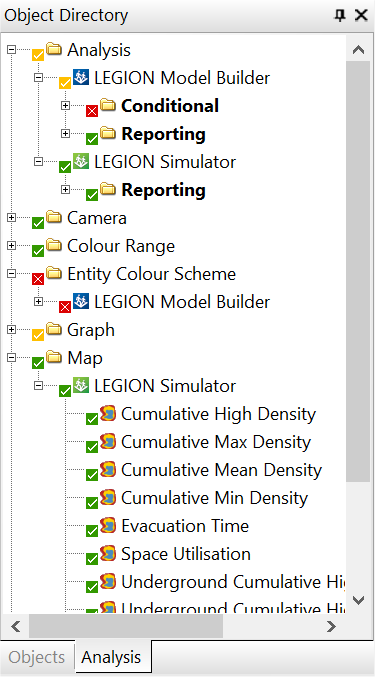
Objects and data are displayed in a tree structure and sorted alphabetically. Click on the + and - icons to expand or close levels of the Object Directory.
Each object in the directory has an eye icon to the left of its name. To hide an object in the workspace, click on its adjacent eye icon to display a bar across it. To show an object again, click the eye icon to remove the bar.
Toolbars
LEGION Simulator has several toolbars, which are initially grouped together above the workspace. The purpose of each icon is explained in this guide as specific tasks are described.
For information on repositioning or customising toolbars, open the LEGION Model Builder help on docs.bentley.com and search for "Repositioning toolbars and turning toolbars off" and "Creating a custom toolbar".
Main Menu Bar
The main menu provides access to all Simulator functionality. All procedures in this guide refer to the main menu options and, when appropriate, the equivalent toolbar options.
Analysis viewing window
This space is for viewing the analysis in progress during playback or recording. Like LEGION Model Builder, you can change the background to white if you prefer (open the LEGION Model Builder help on docs.bentley.com and search for "Changing the workspace background colour".
The Layers window
LEGION Simulator has its own Layer type called Analysis Layers, but you can also view the other LEGION Model Builder Layers (CAD, Activity Object Layers) by using the Object Directory and Layers Directory.
The Layers window enables you to add Analysis Layers, view the properties of existing Layers, add, duplicate and copy Layers. It is displayed alongside the LEGION Simulator workspace and can also be displayed by selecting .
For further information about layers, open the LEGION Model Builder help on docs.bentley.com and search for "Layers".
Graph Windows
These windows display dynamic Graphs linked to active Analyses. You can close or add new Graph Windows.
Output Bar
The Output Bar is designed to provide feedback on your Analyses. It has seven tabs:
- Information
- QA
- Search Results
- OD matrices
- GJT Summary (if enabled; see Analyses and Graphs )
- Analysis
- Conditional Functionality
This displays a certain amount of feedback about the analysis you are currently running. Right-click on this tab for menu options to Clear or Copy the contents of the 'Information' tab. It also has a Command bar where you can type certain commands to do with selecting, placing and editing objects.
This stands for Quality Assurance and displays any errors within your simulation.
This tab displays any relevant results when you search for objects by using the Find tool. Results are listed by object and type.
Right-click on a listed object for the options to Edit Properties or Select Object(s).
This tabbed window displays a dynamic table of origins and destinations related to the model's demand data. It shows demand totals for origin-destination pairs and grand totals for origins and each of their destinations. When you playback or record a simulation, this table is dynamically populated with the numbers of Entities reaching their various targets.
These numbers can be black or red: red numbers denote values that have been updated in the current time-step; black numbers denote values that have not changed in the current time-step. You can save this data as a comma separated value ('csv') file.
This tabbed window displays summary information of Journey Time metrics. The content of the grid is updated as a simulation is run or recorded. See Analyses and Graphs for further information.
This tab of the Output Bar contains information about all and any Analyses within the simulation, including Analysis Objects, Accumulation Interval, Instantaneous results, Cumulative results, Average results, and Average Advanced results.
This tab of the Output Bar contains information about objects using Conditions in the simulation. For Direction Modifiers and objects with conditions or availability, the tab provides the following information: Activity Object name, Availability Profile, Combining Method, Time Before Action, Minimum Activity Period, Maximum Activity Period, Minimum time between actions, Condition, Availability status, and whether the condition has been met at any point within the playback.
The tab is useful for determining when conditions are met and whether objects are active at any given time within a simulation.
Playback toolbar
The playback toolbar is linked to the Timeline (see below) and contains the controls you need for playing, recording, pausing, accelerating and restarting a simulation. See Playing back a simulation .
Timeline
The Timeline enables you to schedule all the key activities that you need to take place during the single playback of a simulation. Having done so, it also provides a visual snapshot of all the activities you have set up and a scrolling ‘dial’ to inform you of what is happening and when during the course of a playback. See About the Timeline for more detailed information.
Status Bar
The Status Bar at the bottom of LEGION Simulator interface displays information regarding (moving from left to right):
- Status of the application and ‘ToolTips’.
- Current position of your cursor (by X and Y coordinates).
- The length, angle and area of any analysis object you may be drawing or placing in the viewing area.
- The state of Auto-save.
- Current Time within the simulation.
- Rate (0.000sec/sec) of the simulation, meaning how many seconds LEGION Simulator is taking to process one second of ‘real time’ within the model.
- Number of Entities (including Clones) within the simulation at any time.
Layer Views
Although you cannot add, duplicate or otherwise manipulate Layers within LEGION Simulator, you can select existing Layer Views within your model as in LEGION Model Builder, by using the Layer View control. For more information, open the LEGION Model Builder help on docs.bentley.com and search for "Layer Views".
Arranging windows
For information on how to move and rearrange windows, open the LEGION Model Builder help on docs.bentley.com and search for "Arranging Windows".
Moving and Hiding components
The Object Directory and Timeline can be moved an hidden as described in the LEGION Model Builder help on docs.bentley.com, (search for "Moving and Hiding Components").